This project was developed as part of SCAD Design Management 710 : Design, Chaos, and Complexity -
Managing Complex Adaptive Systems is a project where I analysed the UN Sustainable Development Goal (SDG) 10- Reduced inequalities and its interlinkages with other SDGs such as Quality Education (SDG 4), Gender Equality (SDG 5), Peace, Justice, and Strong Institutions (SDG 16). I aimed to provide an overview of the SDG 10 from a disability perspective. The word “disability” is not cited directly in all goals, but the goals are indeed relevant to ensure the inclusion and development of persons with disabilities.
Purpose : I sought to create a data visualization tool to help identify impacts & interrelations that start an active dialogue among stakeholders on the SDGs with a view to create a better world for persons with disabilities
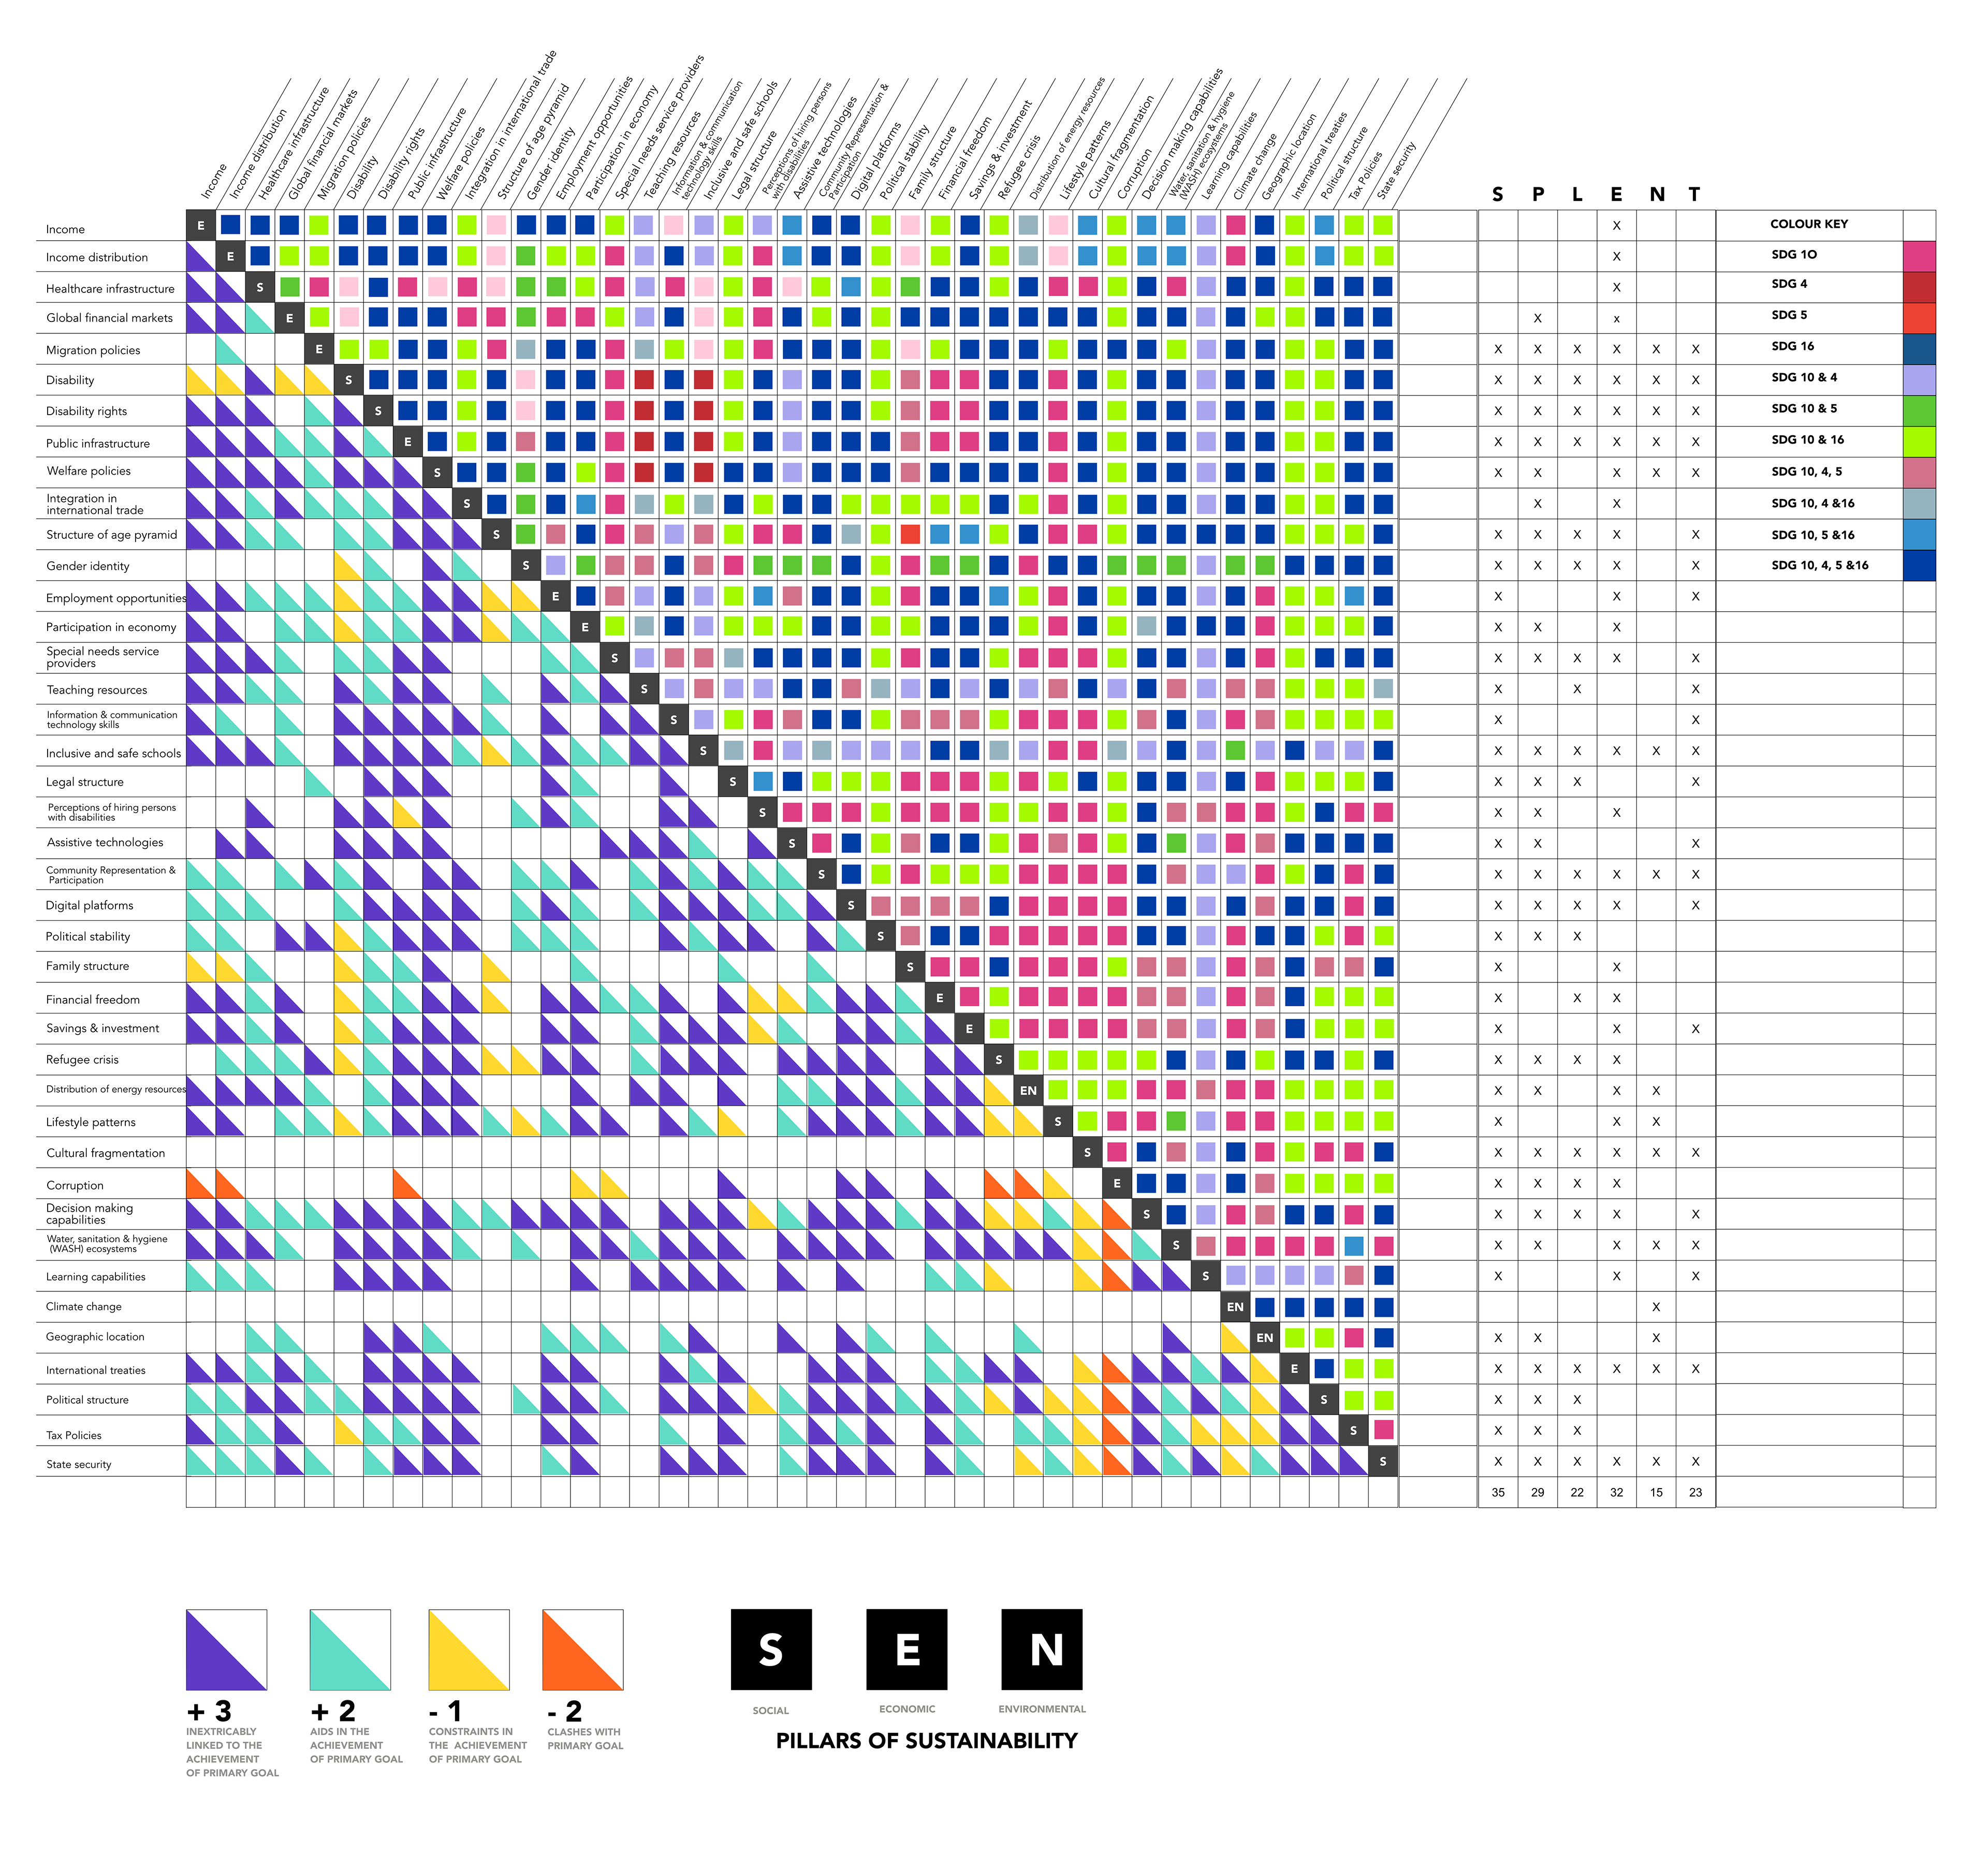
Interaction Matrix
On the left hand and top side of the matrix is the final list of agents (both +3 and +2).
The interaction matrix represents the resulting interaction between the agents, and whether this resulting interaction is -
1) intextricably linked to achievement of the primary goal
2) aids in achievement of the primary goal
3) Constraints in the achievement of primary goal
4) Clashes with primary goal
The key to the interaction can be found on the far right and right below the matrix.
Data Visualisation Tool
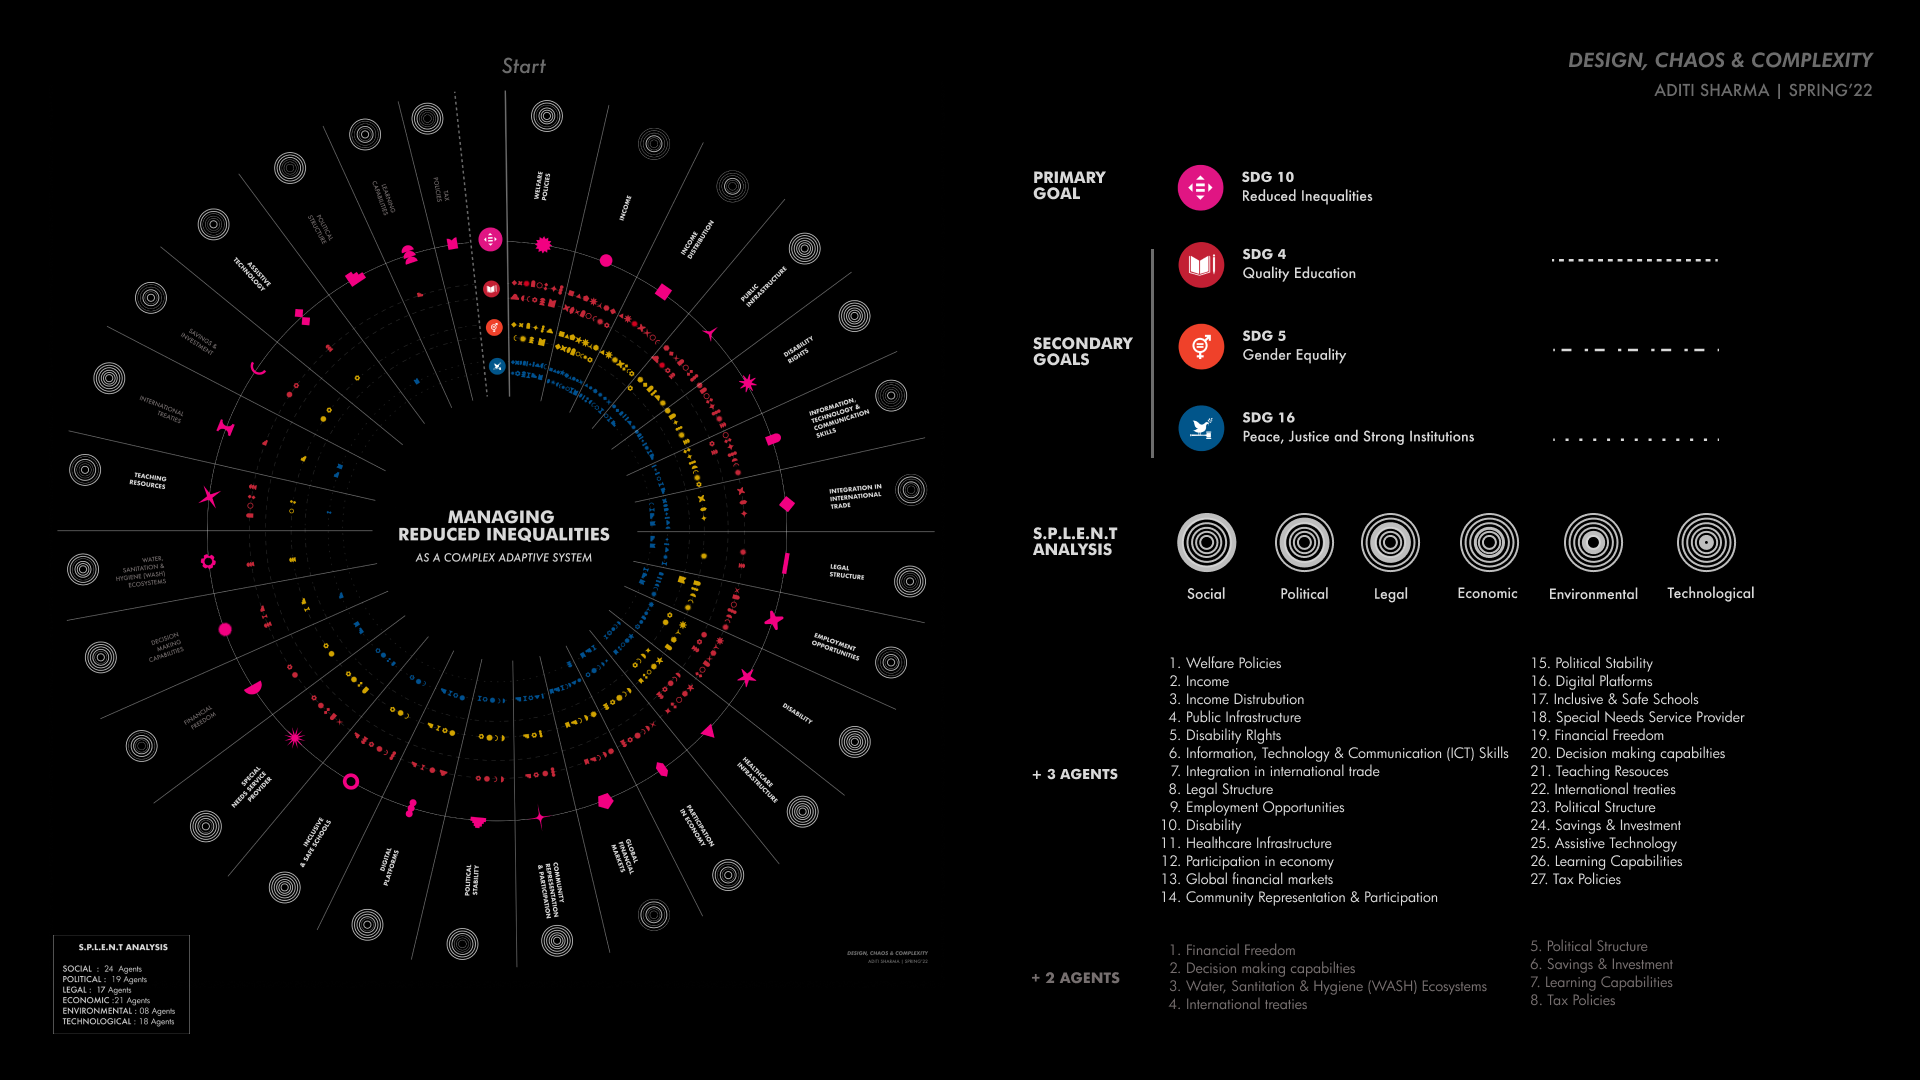
After looking at multiple references and iterating, I found myself inclined to create a visual tool with circular elements. There is a universal allure of the circle that might be rooted in our own visual cognitive apparatus and the way we view the world around us.
Given that I was looking at the brief of this project through the lens of accessibility for all, I felt keeping the visual tool as just symbols/icons (hieroglyphics) would be easy to read and understand for all. Additionally from a purely aesthetic point of view- it would provide me the freedom and liberty to use any and all elements.
An in-depth insight into the process :
March 2022