A data visualization project examining how disability and inequality intersect across interconnected social, political, and institutional systems.
What I noticed
The UN Sustainable Development Goals (SDG) are designed as interconnected systems, yet conversations around disability and inclusion are often approached in isolation. While researching SDG 10: Reduced Inequalities, I became interested in the relationships between inequality, education, gender equity, policy, accessibility, and representation, and how one shift within a system can ripple across many others.
I wanted to explore how systems thinking could help make those interdependencies more visible.
What I explored
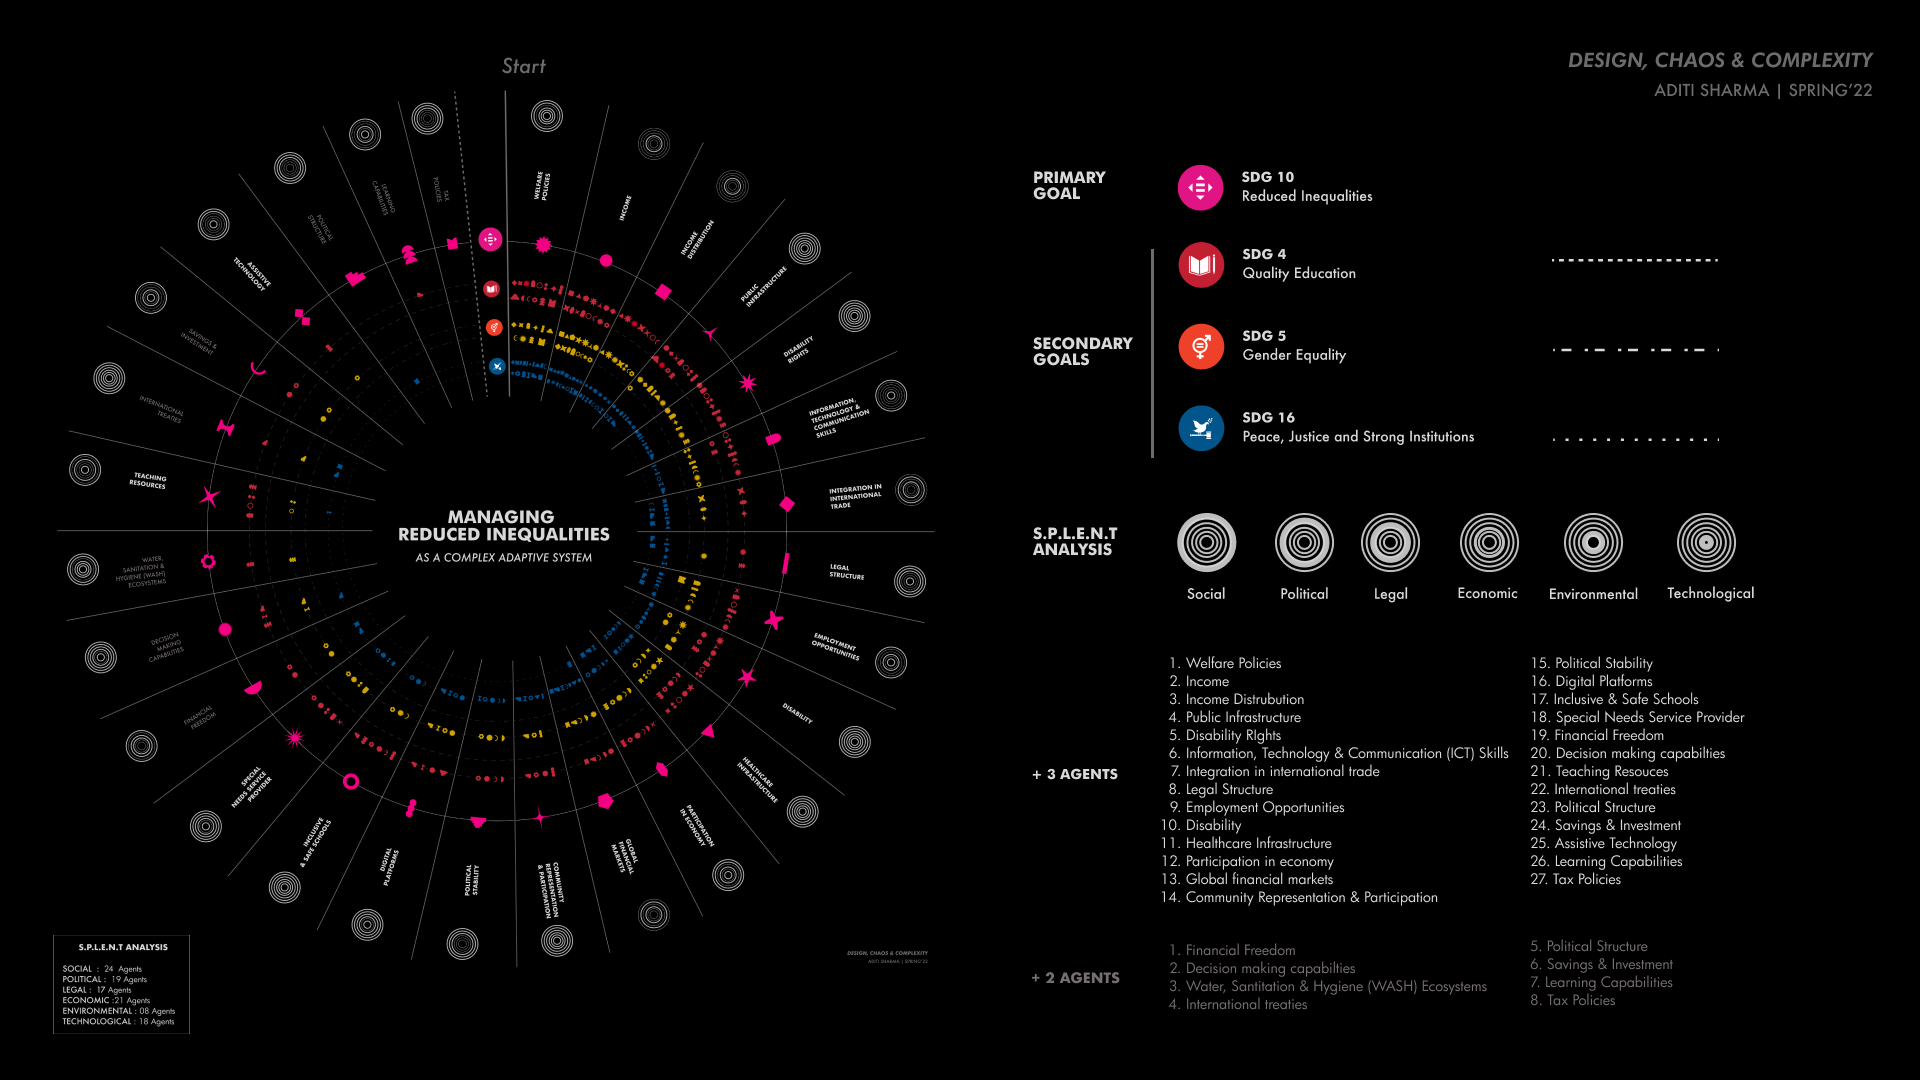
Using SDG 10 as the primary lens, I analyzed its overlaps with SDG 4 (Quality Education), and SDG 5 (Gender Equality), and SDG 16 (Peace, Justice, and Strong Institutions) from a disability perspective.
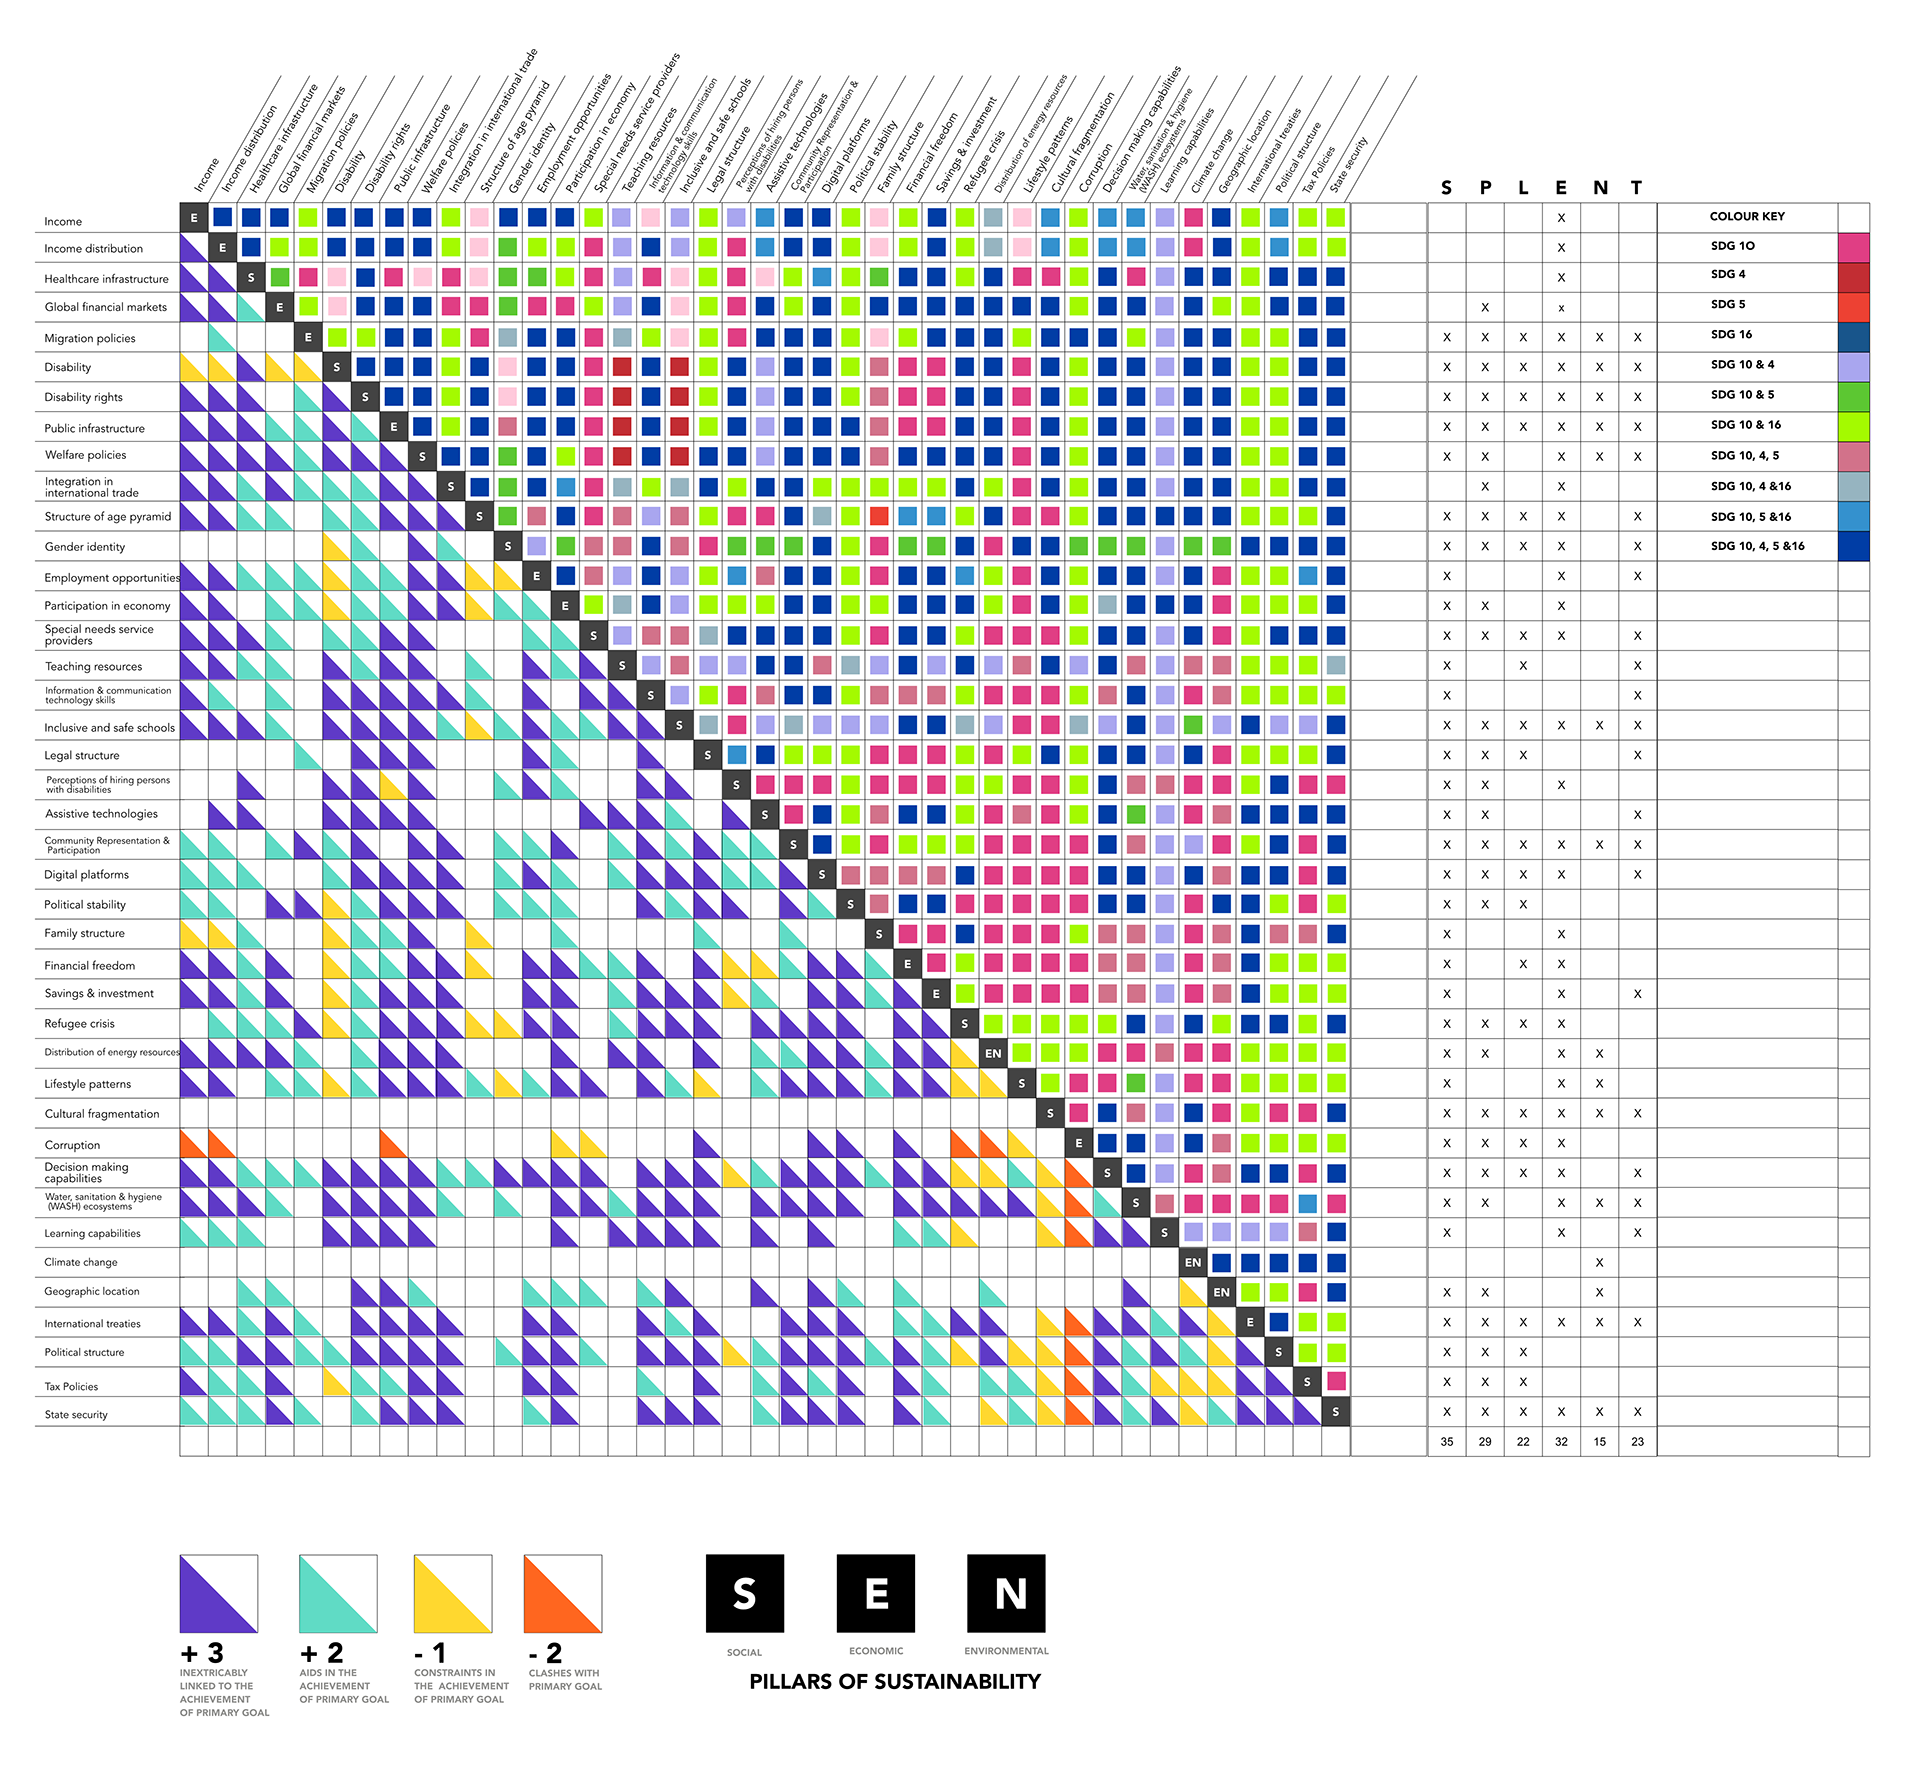
I mapped out different social, political, economic, legal, environmental, and technological agents to understand which interactions supported the achievement of reduced inequalities, which created barriers or tensions, and how these relationships influenced one another within a larger adaptive system.
The project combined interaction mapping, systems analysis, and data visualization frameworks to study both reinforcing and conflicting relationships between agents.
What took shape
The project evolved into a visual systems-mapping tool that translated complex relationships between SDGs, stakeholders, and social factors into an accessible interaction matrix and circular data visualization framework. By combining symbols, color coding, and layered relationship mapping, the final outcome made invisible interdependencies easier to trace, understand, and discuss through a disability and inclusion lens.
What I learned
This project taught me that complexity becomes more approachable when people can see relationships, not just read about them. It also reinforced my interest in designing visual systems that make layered information more accessible, inclusive, and human-centered without oversimplifying the realities they represent.
An insight into the process :